From the desk of Joe Rios
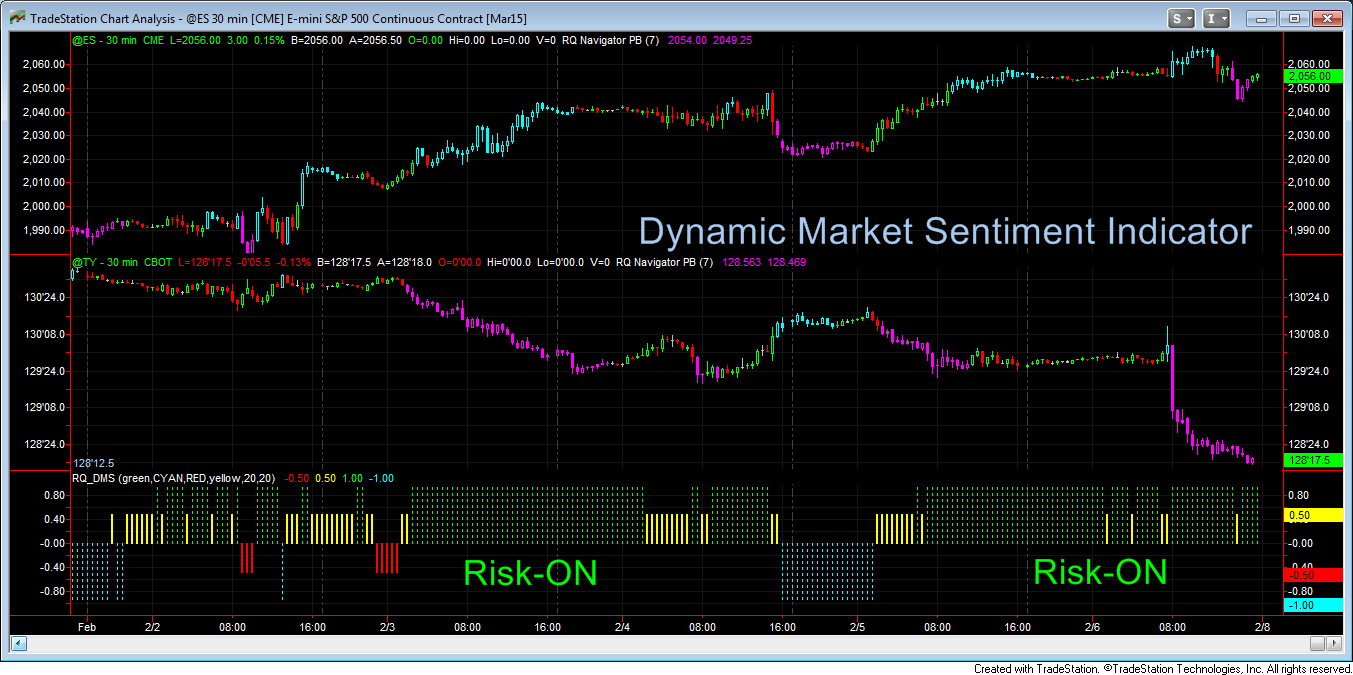
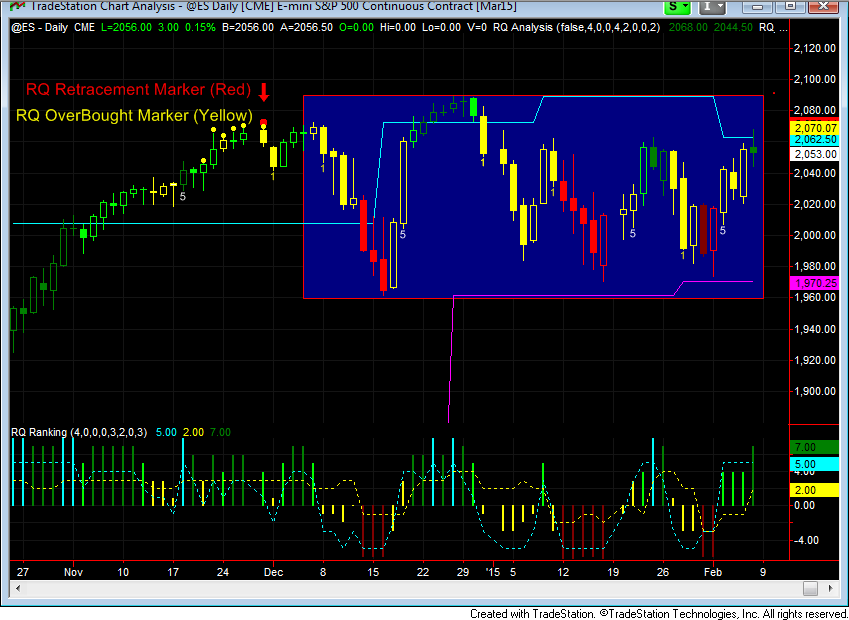
Commodities were in the spotlight last week with Crude Oil finishing the week 8.6% higher in short covering mode. In the grain market Wheat also closed higher 4.9% followed by Corn 4.3%. Conflict was evident In the metals market with Copper gaining 3.8% while Gold dropped -3.6%. Take special note of the correlation between Gold and Treasuries during the past few trading sessions. In the currency market the US Dollar was little changed -0.1% as most foreign currencies consolidated. As illustrated on the chart(1) below Risk-ON sentiment dominated most of the week with rotation flows confirming the S&P 500 rising 3.4% and the US Treasury 10 Yr Note losing -1.8%. The S&P 500 has been trading in a wide range with a significant rise in intra-day volatility since December. The chart(2) below will give you a glimpse of both, the rise in volatility and the range bound price action. Will the stock indices continue to trade in-the-box or will we see a break out-of-the box with further Risk-ON rotation flows in the week ahead? My main focus on the first day of trade for the week will be on the correlation between the bond and stock markets. As you can see from the chart(1) below the US Treasuries sold off following Friday’s employment data however the stock indices failed to trade higher. Trade Balance from China over the weekend was poor with exports falling 3.3% while imports tumbled 19.9%, far worse than analysts had expected and highlighting deepening weakness in the world’s second largest economy.
 Chart(1) S&P 500 and US Treasury 10 Yr Note with the RQ-DMS Risk-ON, Risk-OFF, Mixed and Conflict histogram for February 2nd through the 6th, 2015.
 Chart(2) Daily chart of the S&P 500
After more than two years of development and testing both in beta and out-of-sample, last Thursday we unveiled the powerful new risk analytics, the @C-Kal histogram and the overbought/oversold and retracement indicators, the oBoS-R markers. We had a record attendance from our members and I want to take this opportunity to thank you. Everybody at RiosQuant is excited about how these new indicators may be your game changer for 2015. The chart above shows the oBoS-R markers at work on the S&P 500 daily chart(2).
Joe Rios
Founder – Rios Quantitative LLC
The Trading Room® TradeLAB – Global Trading with Quantitative Technologies
Monday and Tuesday – 7:30 AM to 10:30 AM ET
RQ trade coaches include Agustin Criado and Joe Rios. Live demonstration of our pre-market quantitative analysis, real-time trading signals with RQ algorithmic technology, strategy performance review and Q&A session.
IQ Room – Advanced Concepts with Joe Rios
Subscription Only – Two Week Free Trial Click Here
Monday, Thursday and Friday 11:00 am to 12:30 pm ET
RQ EDU – Does Size Really Matter?
Tuesday – 8:00 pm ET Register on the following link:
https://attendee.gotowebinar.com/register/4479376651100756225
In a word, yes. Especially if we’re talking about profit and losses. Join RiosQuant performance coaches Ken Eriksen, Agustin Criado and Joe Rios and find out what you need to know to capture bigger profits with the same signal. The RQ Team will share their step-by-step approach to spotting the bigger opportunities in the current market environment.
Scheduled Economic Reports That May Have an Impact on the Markets
Monday
Day One All Day G 20 Meetings
7:30 PM AUD NAB business confidence
8:30 PM CNY CPI
Tuesday
Day Two All Day G 20 Meetings
4:30 AM GBP Manufacturing Production
8:20 AM USD FOMC Member Lacker Speaks
10:00 AM GBP NIESR GDP estimate
10:00 AM USD JOLTS Job Openings
Wednesday
All Day EUR Eurogroup Meetings
10:30 AM Crude Oil Inventories
1:01 PM USD 10 Year Note Auction
7:30 PM AUD Unemployment Rate
Thursday
5:30 AM GBP BOE Inflation Report And Gov. Carney Speaks
10:30 AM Natural Gas Storage
5:30 PM AUD RBA Gov. Stevens Speaks
Friday
8:30 AM CAD Manufacturing Sales
10:00 AM USD Preliminary UoM Consumer Sentiment

Comments
1,873 responses to “The Week Ahead in the Global Financial Markets”